
In a move designed to enhance user autonomy and cater to the diverse analytical preferences of its community, Gold Derby has officially announced the implementation of a new customizable interface for viewing award prediction odds. Starting this week, users can toggle between fractional and percentage-based displays, a significant update that bridges the gap between traditional handicapping methods and modern statistical forecasting.
Main Facts: A New Era of Personalization
The announcement, which affects all registered users on the Gold Derby platform, allows for a seamless transition between two distinct mathematical frameworks for viewing award race data. Previously, the platform maintained a rigid display format; now, the user interface empowers the individual to decide how they visualize the probability of a nomination or an eventual win.
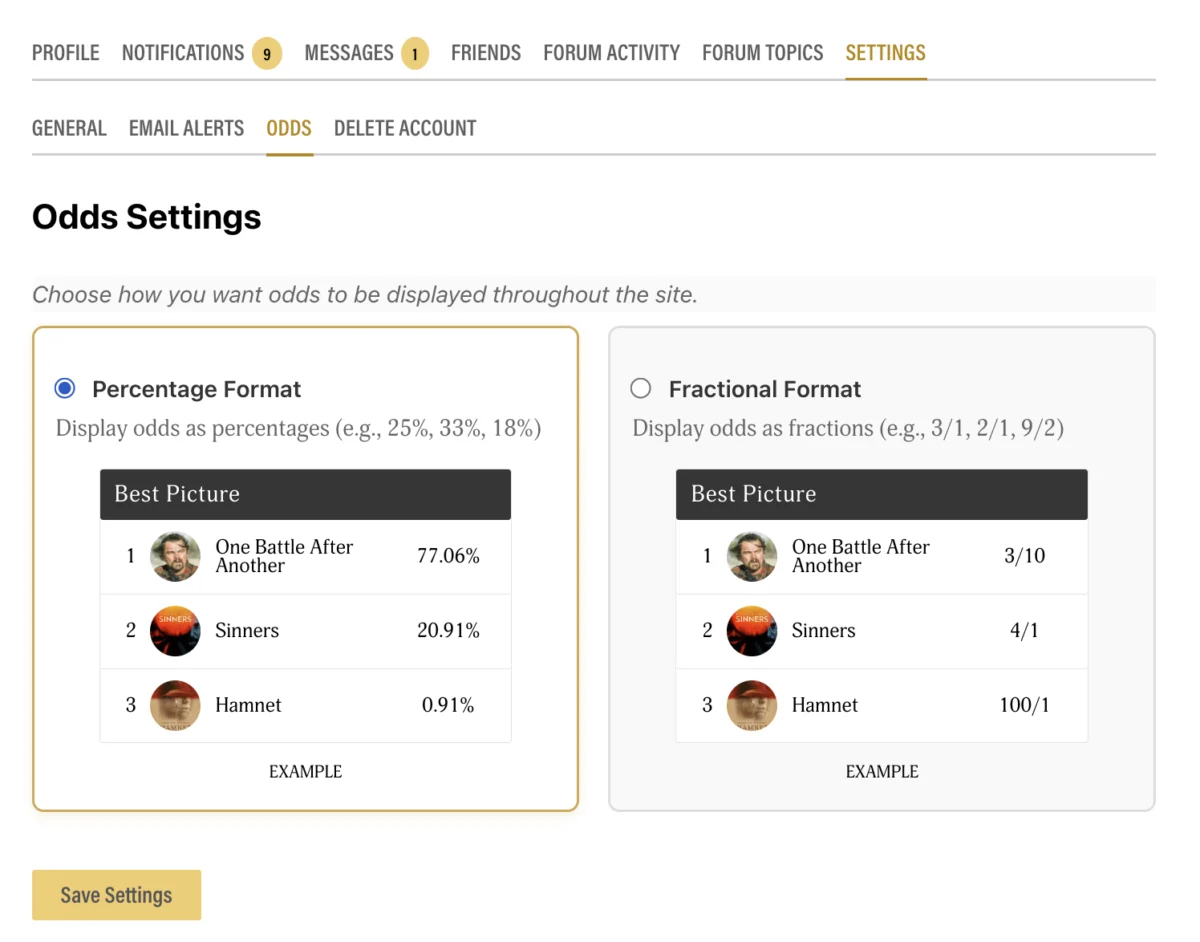
The new functionality is tucked within the user profile ecosystem. By navigating to View Profile > Settings > Odds, members can now select their preferred format. Whether a user favors the classic “racetrack” style or the contemporary “probability-based” approach, the platform ensures that the chosen data format is preserved across the site. This change is not merely aesthetic; it reflects a deeper commitment to data accessibility for both casual spectators and professional awards analysts.
Chronology: The Evolution of Gold Derby’s Data Strategy
To understand the significance of this update, one must look at the evolution of Gold Derby’s reporting standards over the last several years.
The Fractional Era
For the majority of its history, Gold Derby utilized fractional odds—a system deeply rooted in the traditions of horse racing and sports betting. In this format, odds like 5/1 indicated that for every $1 wagered (or, in this case, for every unit of certainty), there would be a $5 profit if the outcome occurred. For many longtime users, this was the language of prediction. It provided a clear, intuitive sense of "value" regarding a candidate’s chances.
The Shift to Percentages
Approximately one year ago, Gold Derby made the strategic decision to pivot exclusively to percentage-based odds. The rationale was grounded in the desire for clarity. In an increasingly data-driven environment, percentages allow users to immediately grasp the likelihood of an outcome—for instance, a 20% chance versus an 80% chance—without needing to perform mental arithmetic. This change was aimed at the "regular user," someone who might not have a background in betting markets but wanted an immediate, legible assessment of an actor or film’s momentum.
The Hybrid Solution
While the percentage shift was widely praised for its accessibility, it left a segment of the "power user" base—those who track award races with the precision of high-stakes gamblers—feeling alienated. The recent announcement marks the final stage of this evolution: a hybrid model that acknowledges the value of both systems, allowing the user to act as the architect of their own data experience.
Supporting Data: Why Format Matters in Analytics
The choice between fractional and percentage odds is more than just a matter of preference; it touches on how humans process risk and probability.
The Psychology of Fractional Odds
Fractional odds are often favored by those who think in terms of "payouts" or "return on investment." In the world of awards forecasting, analysts often view a contender as a "long shot" (e.g., 20/1) or a "sure thing" (e.g., 1/5). This terminology carries historical weight and is deeply embedded in the culture of industry handicapping. By reintroducing this, Gold Derby is essentially preserving the lexicon of the awards-season veteran.
The Utility of Percentage Odds
Conversely, percentage odds are the gold standard for statistical modeling. When an algorithm calculates the likelihood of an Oscar win based on precursor wins (Golden Globes, SAG, BAFTAs), it does so using decimals and percentages. For users who are interested in the "math" behind the prediction, percentages are far more efficient. They allow for easier aggregation and comparison; it is mathematically simpler to compare a 45% chance to a 30% chance than it is to compare 11/9 to 7/3.

By offering both, Gold Derby is effectively providing a "bilingual" interface that speaks to both the traditional handicapper and the modern data analyst.
Official Responses and Rationale
Gold Derby’s internal development team emphasized that the change was prompted directly by user feedback. In a brief statement accompanying the update, representatives noted, "We recognize there’s value to both approaches. Our goal has always been to be clearer about whether an award is going to happen or not, but we understand that different users have different mental models for processing that information."
The platform’s leadership indicated that the switch to percentage odds a year ago was a necessary step in modernizing the user experience, but they were not prepared for the depth of loyalty users felt toward the fractional format. This update serves as a "reconciliation" of sorts, where the platform retains the modern, clean look of its percentage-based forecasts while restoring the functional tools that built the brand’s early reputation.
Implications: What This Means for the Future of Forecasting
The decision to allow customizable odds formats has several implications for the future of Gold Derby and the wider community of awards prognosticators.
Empowering the Community
First, this update lowers the barrier to entry for new users while simultaneously respecting the expertise of veterans. It is a masterclass in UX design: by giving the user agency, the platform increases the time spent on site and the depth of engagement with the prediction tools.
Standardization of Data
Second, this move sets a precedent for other prediction-based platforms. As award races become more "gamified"—with apps and sites constantly tracking industry trends—the need for flexible data visualization becomes paramount. Gold Derby is signaling that, in the future, the "correct" way to show data is the way that the user finds most useful.
The Data-Driven Season
As we look toward the upcoming awards season, the ability to toggle these settings will likely influence how users track the rise and fall of various contenders. Analysts will be able to switch to percentages to see the hard probability of a win, then flip to fractional odds to see how the "market" of experts is viewing the value of a potential underdog.
Conclusion: A User-Centric Milestone
The update is simple, yet it represents a significant milestone in Gold Derby’s history. By embracing a flexible data philosophy, the platform is ensuring that it remains the premier destination for awards enthusiasts, regardless of their preferred analytical style.
As users navigate to their settings to make the switch, they are participating in a larger trend: the personalization of the internet. Whether you are a math-focused statistician or a traditionalist who prefers the thrill of the "racetrack" odds, Gold Derby has ensured that your view of the race is exactly how you want it to be.
Remember to save your settings. Once you have toggled your preference in the Odds section of your profile, ensure you click the save button before navigating away. This small step ensures your preference is cached, providing a consistent experience for the remainder of the awards cycle. As the race for the next major industry trophies heats up, having your data presented in the language you understand best will be the ultimate competitive advantage.
